View SaaS Connections
You can navigate to the SaaS Connections page on the Data Protection as a Service UI to:
-
View the list of SaaS Connections deployed and their details.
-
Manually deploy a new SaaS Connection.
To view the SaaS Connections page, in Cloud Protection Service, navigate to Settings > SaaS Connections. On the SaaS Connections page, you can view:
-
Glance Bar
-
SaaS Connections Details Table
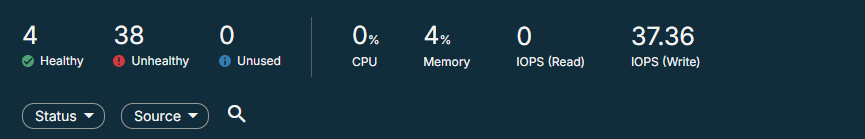
Glance Bar
The glance bar on the Saas Connections page provides a summary of the following information:
-
The total number of Healthy SaaS Connections.
-
The total number of Unhealthy SaaS Connections.
-
The total number of Unused SaaS Connections.
-
The total percentage of CPU utilized by the SaaS Connections.
-
The total percentage of memory utilized by the SaaS Connections.
-
The average number of read and write I/O operations per second across the SaaS Connections.
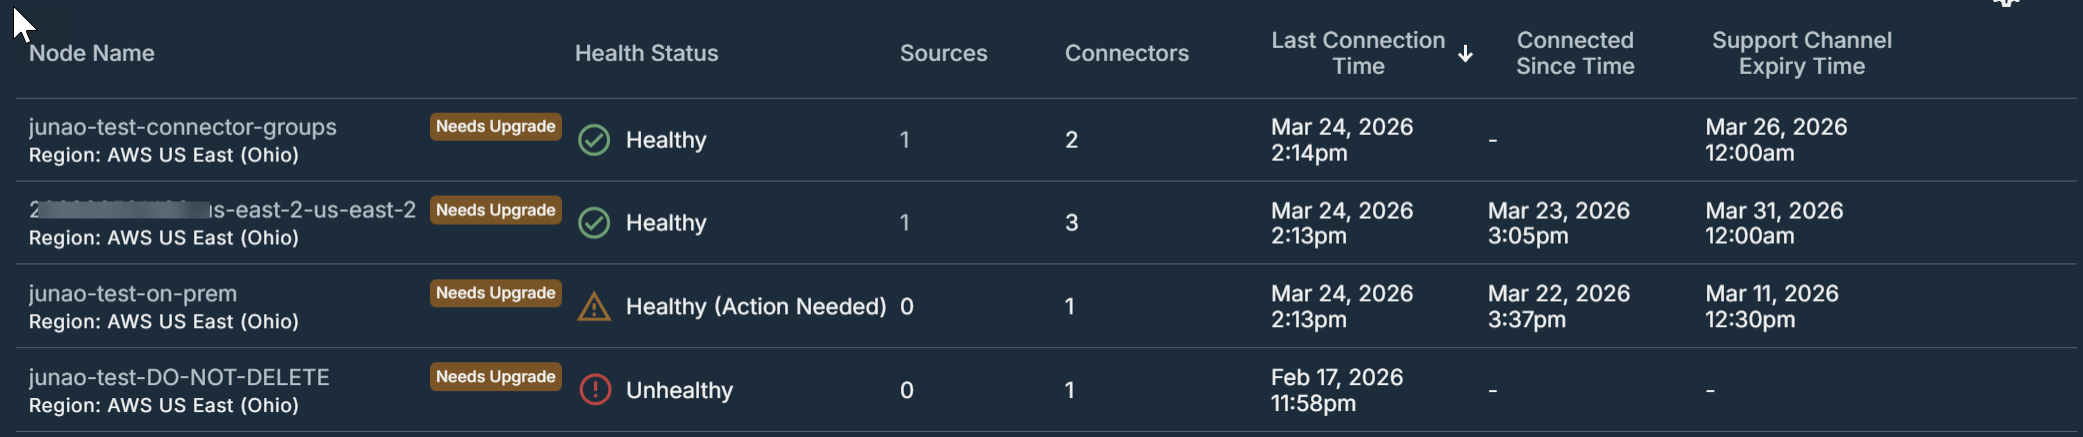
SaaS Connection Details Table
The table below describes the data displayed in the SaaS Connection table:
You can use the:
-
Search bar to filter SaaS Connections by name.
-
Status filter option to filter the SaaS Connection based on:
-
Healthy: Displays only the healthy SaaS Connections.
-
Unhealthy: Displays only the unhealthy SaaS Connections.
-
Unused: Displays only the unused SaaS Connections.
-
-
Source filter option to filter the SaaS Connection based on the Source it is deployed on.
| Column Name | Description |
|---|---|
| Name | The name of the SaaS Connection. |
| Sources | The number of sources that use the SaaS Connection. |
| Connectors | Number of SaaS connectors in the SaaS Connection. |
| Last Connection Time |
The timestamp when the SaaS Connection was last found to be healthy. |
| Connected Since Time |
The timestamp from when the SaaS Connection was continuously connected.
|
| Support Channel Expiry Time | The date and time when the Support channel access expires. |
View SaaS Connection Details
To view the list of SaaS Connectors of a SaaS Connection, their status, resource matrices, and the sources utilizing the SaaS Connection, select the SaaS Connection from the SaaS Connection details table.
The SaaS Connection details page contains the following tabs:
-
Connection Details Tab
-
Linked Sources Tab
-
Mapping Tab
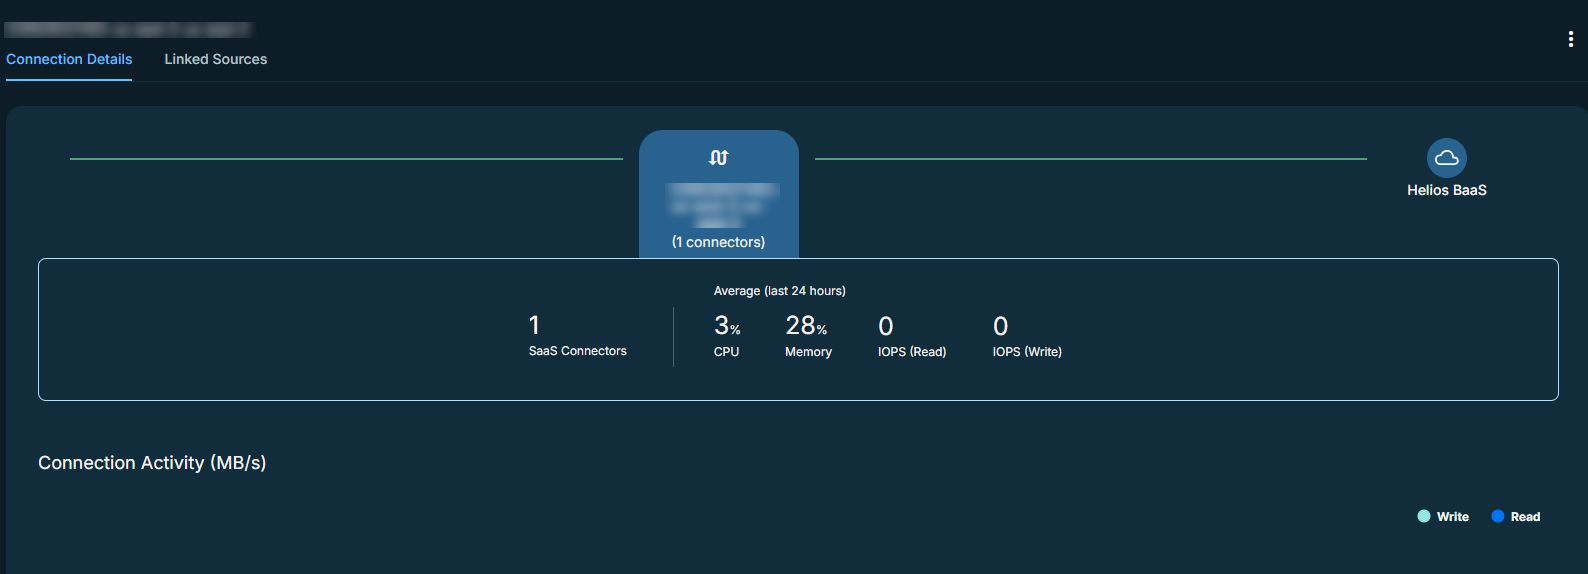
Connection Details Tab
The Connection Details tab of a SaaS Connection displays the following:
-
A graphical representation of how the SaaS connection acts as the data mover between the data sources and the Cohesity Cloud Protection Service.
-
The number of SaaS Connectors in the SaaS Connection.
-
The percentage of CPU and memory utilized, and the read and write I/O operations.
-
A graph displaying the write I/O operations (in MB/s) on the SaaS connection.
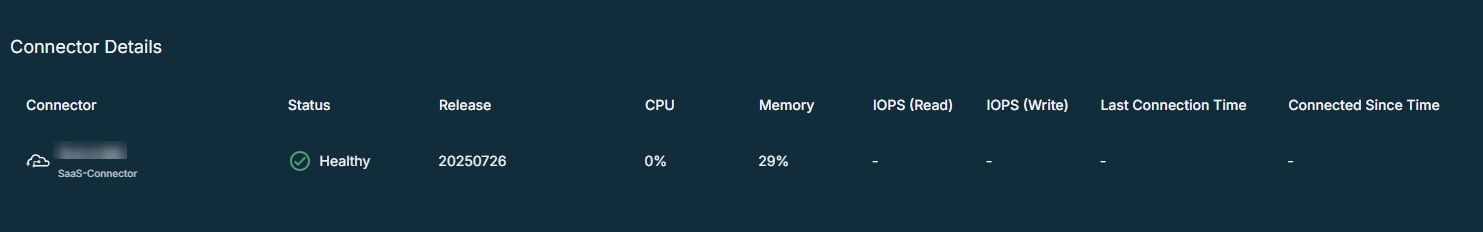
Connector Details Table
The table below describes the data displayed in the SaaS Connector details table:
| Column Name | Description |
|---|---|
| Connector | The list of Connectors in the SaaS connection. |
| Status |
The status of the SaaS connector:
To view the endpoints that are not connected with the SaaS Connector, see the View SaaS Connector Details page. |
| Release | Connector version. |
| CPU | The percentage of CPU utilized by the SaaS connector. |
| Memory | The percentage of memory utilized by the SaaS Connector. |
| Support Channel Status |
Indicates the current state of the Support channel enablement.
|
| IOPS (Read) | The average number of read operation per second on the SaaS Connector. |
| IOPS (Write) | The average number of write operation per second on the SaaS Connector. |
| Last Connection Time |
The timestamp when the Connector was last found to be healthy. This option is not applicable for SaaS connectors connected to Azure data plane regions. |
| Connected Since Time |
The timestamp from when the connection was continuously healthy. This option is not applicable for SaaS connectors connected to Azure data plane regions. |
-
*Primary endpoints: Control Plane, Data Plane, and Cloud Object Store.
-
**Secondary endpoints: DNS, Gateway, NTP, Reverse Tunnel (SSH and HTTPS), SaaS Connector Upgrade Package.
View SaaS Connector Details
To view the resource utilization of a SaaS Connector, as well as the status, ports, and connection timestamps of its connected endpoints, select the desired SaaS Connector from the SaaS Connector Details table.
In the SaaS Connector Details page, you can view:
-
A glance bar displaying the percentage of CPU and memory utilized, and the read and write I/O operations.
-
Endpoint Details Table
-
Graphical representation of the percentage of CPU and memory utilized, and the read and write I/O operations.
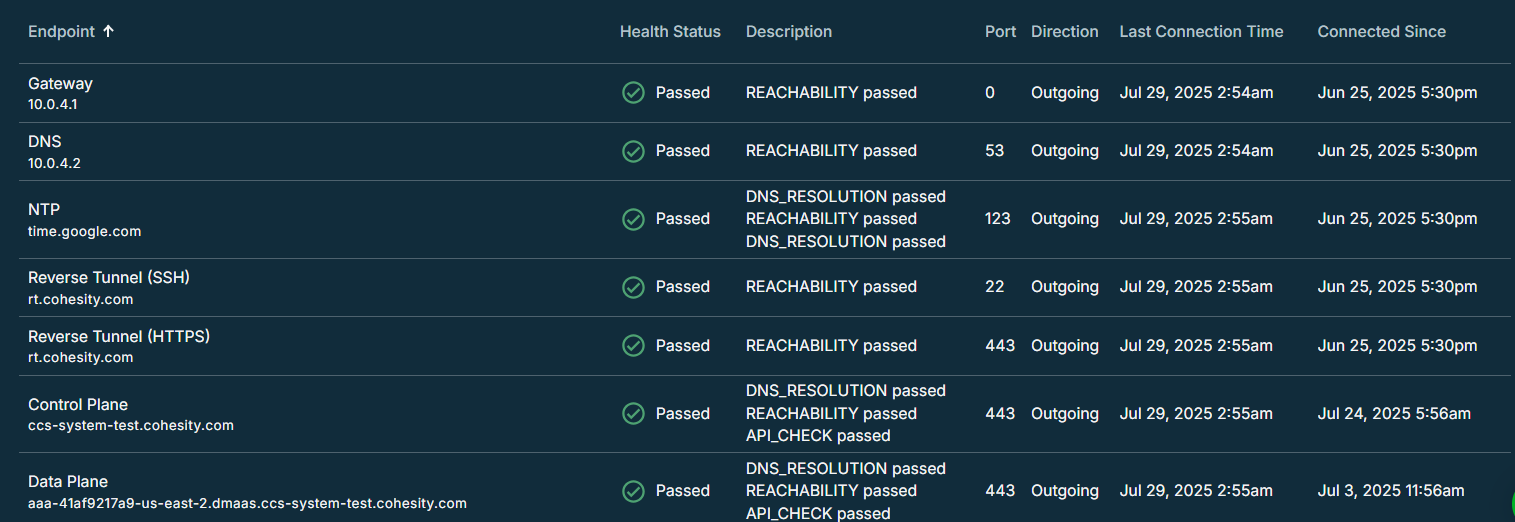
Endpoint Details Table
The table below describes the data displayed in the endpoint details table:
The endpoint details table is not available for SaaS connectors connected to Azure data plane regions.
| Column Name | Description |
|---|---|
| Endpoint | The endpoints connected to the SaaS Connector. |
| Health Status |
The health status of the endpoints:
Refer to the Troubleshooting Endpoint Health Checks section to view the health checks performed for validating the health status and resolving health check failures. |
| Description | The corresponding message related to the health status. |
| Port | The port through which the endpoint is connected to the SaaS Connector. |
| Direction | The traffic flow to the endpoint. |
| Last Connection Time |
The timestamp when the endpoint was last found to be healthy. |
| Connected Since |
The timestamp from when the endpoint was continuously connected to the connector. |
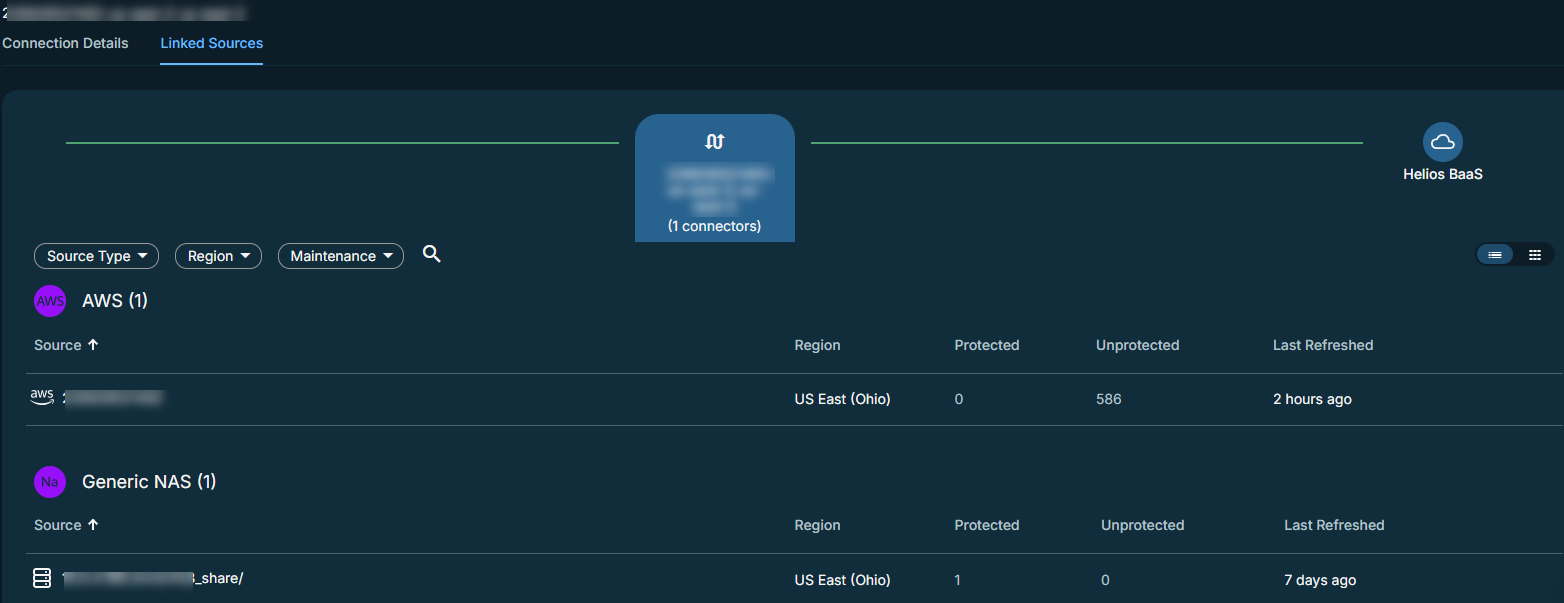
Linked Sources Tab
The Linked Sources tab displays the sources that use the selected SaaS Connection to protect the source data.
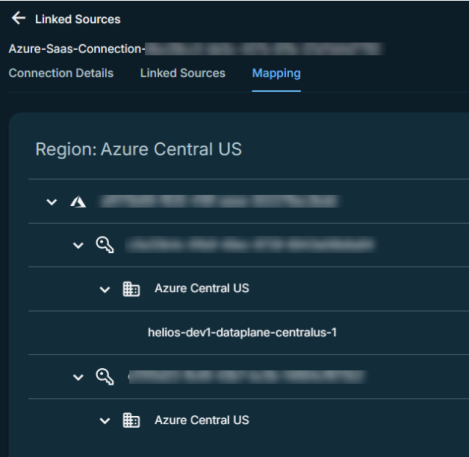
Mapping Tab
This tab is applicable only for Azure SaaS Connectors.
The Mapping tab of a SaaS Connection displays the virtual networks that are mapped to the SaaS Connectors. Mapping of virtual networks enables the protection of resources within those networks. For more information, see Manage Azure SaaS Connections.