Dashboard
The panels in the SiteContinuity Dashboard provide a summary of the following aspects of your SiteContinuity instance, allowing you to assess the status quickly.
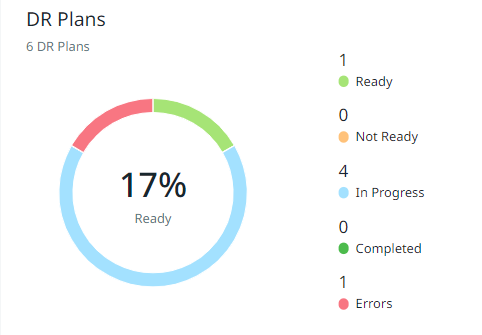
DR Plans Panel
Displays the total number of DR plans you’ve created in SiteContinuity and the stats on the activation, failovers, and failbacks of the DR plans. The panel displays the number of DR plans that are ready, not ready, and in progress with activation, failover, and failback. The number of DR plans with completed failovers and failbacks is also displayed. The panel also displays the number of DR plans that have not completed the activity due to errors.
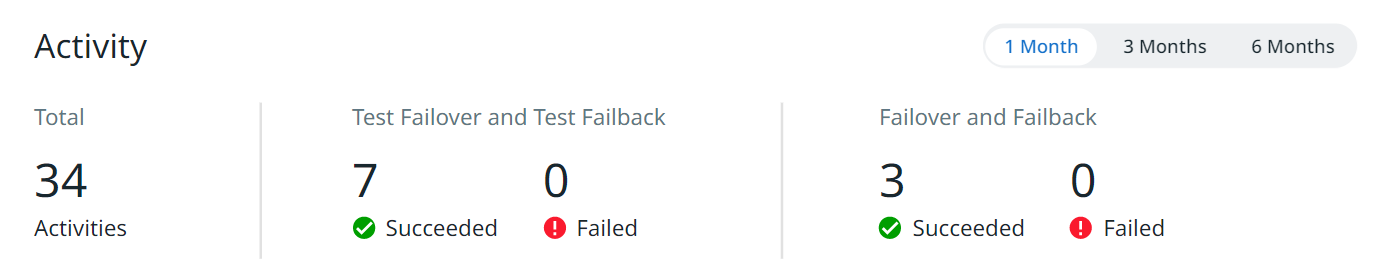
Activity Panel
Displays the number of times the DR Plans were successfully tested and the number of times the tests failed in the last six months. This panel also displays the number of times actual failovers and failbacks succeeded and failed.
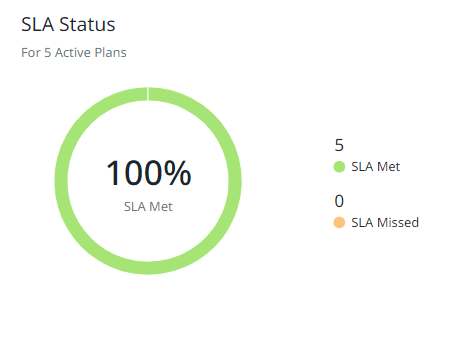
SLA Status Panel
Displays the number of active DR Plans that have met and not met the SLAs.
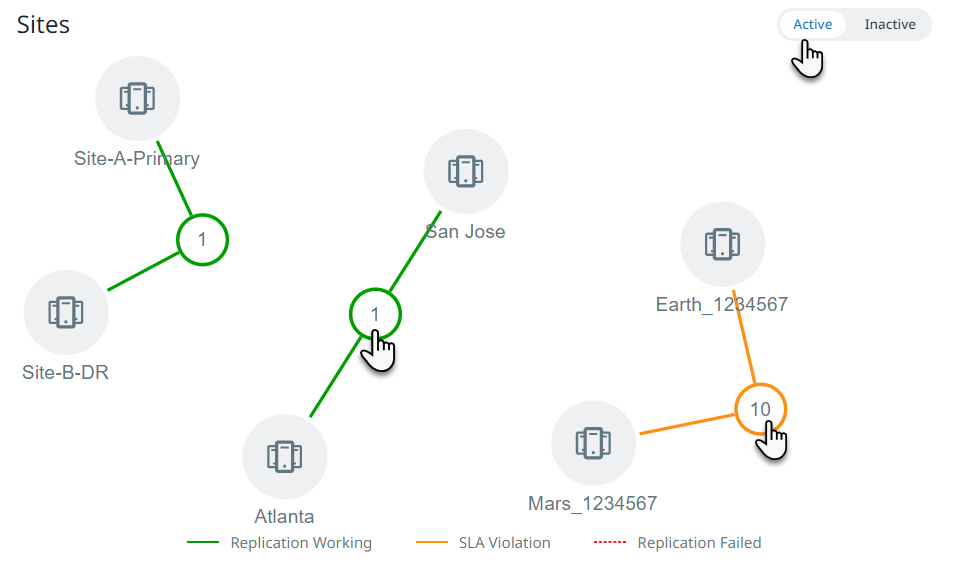
Sites Panel
The Sites panel has a tab each for active and inactive sites you have created in SiteContinuity. The Active tab displays the mapping between the active sites and the number of DR plans created between each site. The Inactive tab displays the inactive sites. The mapping lines' color indicates the DR plans' status:
-
Green. Indicates that replication is successful between the sites.
-
Yellow. Indicates that some or all DR plans have missed SLAs.
-
Red. Indicates that replication has failed between the sites.
Click the number of DR plans to view the list of DR plans. Click the site to see the latest status of the site, the name and ID of the cluster, and the defined geographical location of the site.